

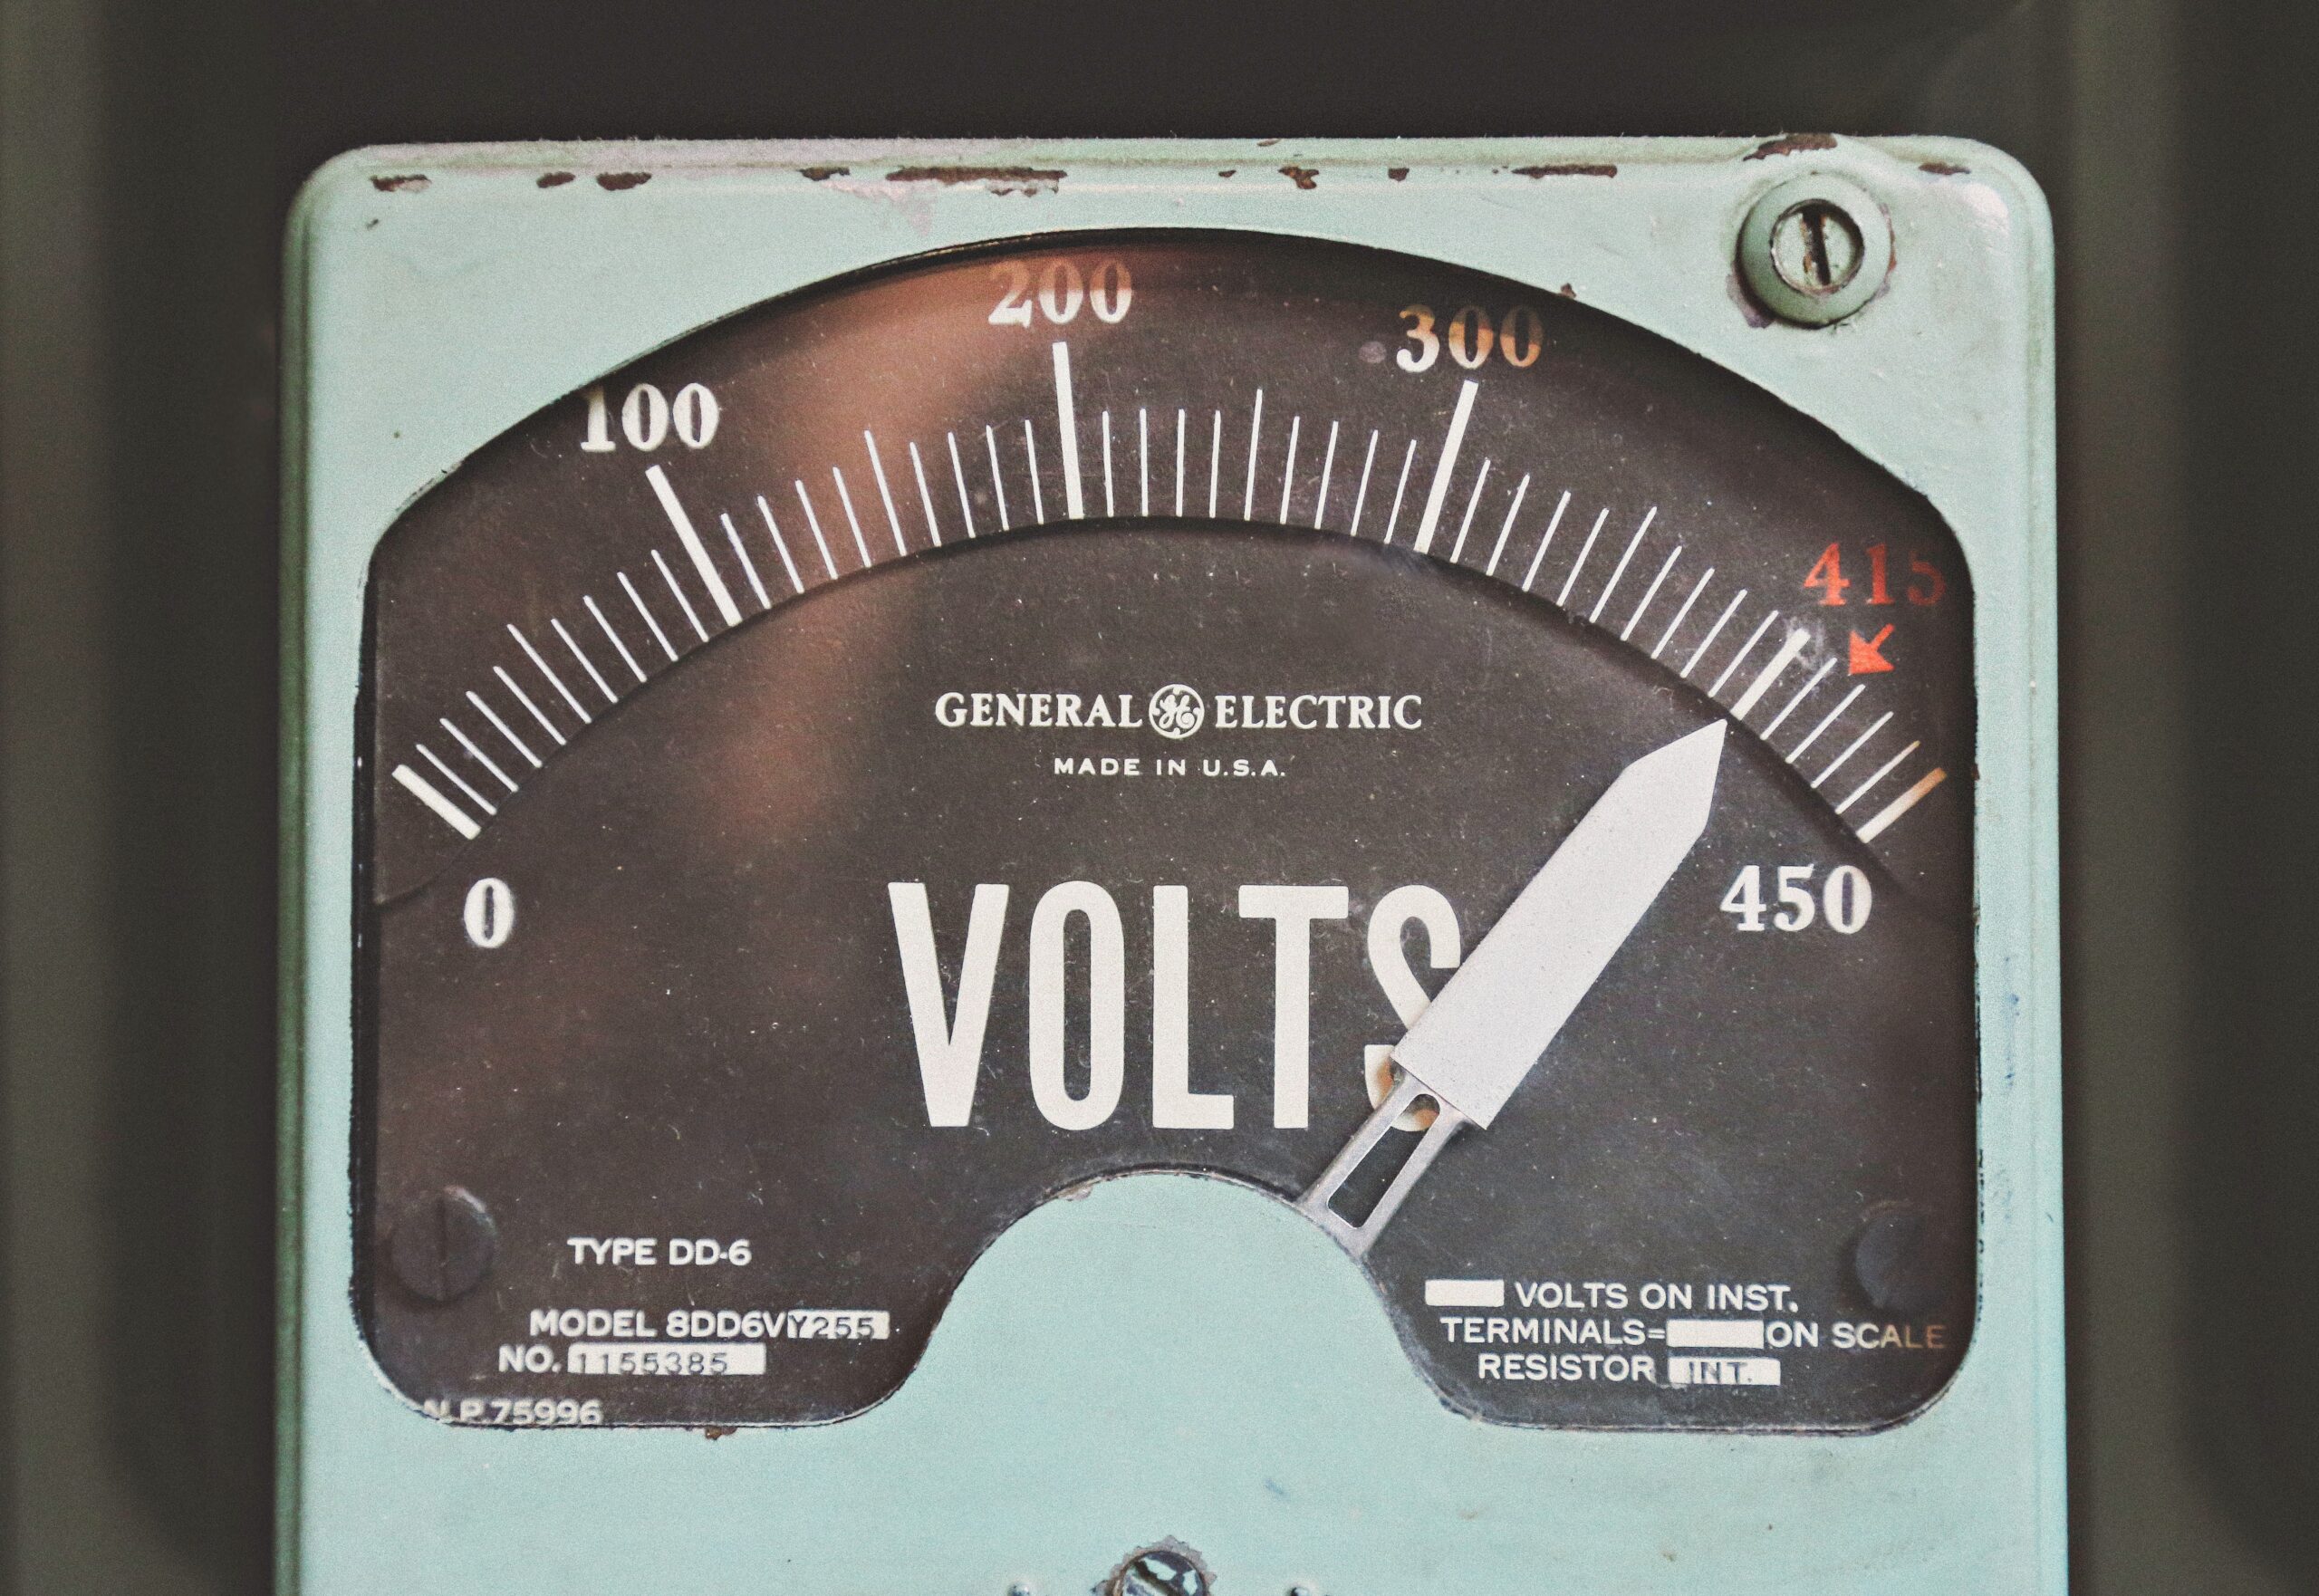
Your utility measures demand in rolling 15-minute intervals. Learn how the meter picks the single peak that sets 40 to 70% of your monthly bill.

A single 15-minute peak can set 40 to 70% of your commercial electric bill. Learn how demand charges work and how facilities can reduce them.

Most districts with solar know what their panels produce, not what they save. How to get a verified dollar figure every month from your billing data.

Food service, rentals, and after-hours use all add to your electric bill. How districts track those costs by function and recover what belongs elsewhere.

Geothermal buildings have their own demand patterns. How precision metering finds the peaks, cuts the bill, and proves performance in ENERGY STAR.

How monthly metering data lowers your electric bill and keeps your ENERGY STAR Portfolio Manager scores current without manual data entry.
Cut electric bills 10 to 25 percent and recover the energy costs of third-party facility use, using interval data tied to your actual tariff.
One 15-minute spike can set a school building's demand charge for the whole month. What drives those peaks and what it takes to stop them.

Your electric bill has two main parts, and the one most business managers overlook is usually the bigger one. A line-by-line guide to what you pay for.

Five questions to ask before you buy energy monitoring for your district, and how to tell a tool that shows data from a service that delivers savings.
Recent Comments